From the Brookings Institute “Metropolitan Opportunity Series” Papers:
In December 2013, President Obama gave a speech on economic mobility, in which he called income inequality and lack of upward mobility “the defining challenge of our time.”
That challenge is front and center in America’s big cities today. Obama’s speech followed a series of municipal elections in November 2013 in which inequality figured prominently as a campaign issue. Foremost among these was in New York City, where Bill de Blasio won a landslide election after campaigning to address what he called a “Tale of Two Cities.” Similar themes were sounded in the successful campaigns and first days in office of Marty Walsh in Boston, Ed Murray in Seattle, and Betsy Hodges in Minneapolis. The “Google Bus” in San Francisco’s Mission District has shone a spotlight on growing economic divisions within that city. And income inequality will no doubt be a central issue in mayoral elections during the next couple of years in cities like Chicago and Washington, D.C.
Inequality may be the result of global economic forces, but it matters in a local sense. A city where the rich are very rich, and the poor very poor, is likely to face many difficulties. It may struggle to maintain mixed-income school environments that produce better outcomes for low-income kids. It may have too narrow a tax base from which to sustainably raise the revenues necessary for essential city services. And it may fail to produce housing and neighborhoods accessible to middle-class workers and families, so that those who move up or down the income ladder ultimately have no choice but to move out.
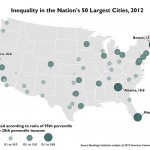
There are many ways of looking at inequality statistically; one useful way to measure it across places is by using the “95/20 ratio.” This figure represents the income at which a household earns more than 95 percent of all other households, divided by the income at which a household earns more than only 20 percent of all other households. In other words, it represents the distance between a household that just cracks the top 5 percent by income, and one that just falls into the bottom 20 percent. Over the past 35 years, members of the former group have generally experienced rising incomes, while those in the latter group have seen their incomes stagnate.
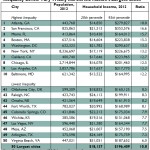
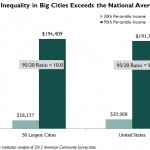
The latest U.S. Census Bureau data confirm that, overall, big cities remain more unequal places by income than the rest of the country. Across the 50 largest U.S. cities in 2012, the 95/20 ratio was 10.8, compared to 9.1 for the country as a whole. The higher level of inequality in big cities reflects that, compared to national averages, big-city rich households are somewhat richer ($196,000 versus $192,000), and big-city poor households are somewhat poorer ($18,100 versus $21,000).


